Click on the tabs to learn more about the analytics available for review of StarMeter alerts and responses.
Additional questions about StarMeter can be sent to _Star Meter Support.
RXM Analytics
Scores
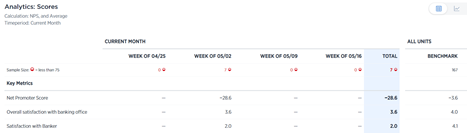
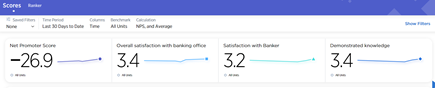
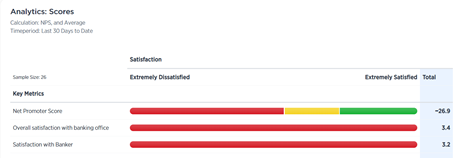
The scores section expands the scores on key drivers and the specific questions that make up that key driver. The bar across the top displays the current filters that are selected.
To view the analytic scores, do the following:
- Click Analytics > Scores.
- Use the view selector to choose your view.
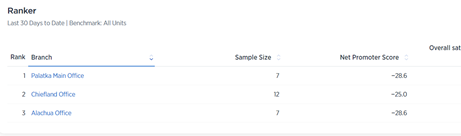
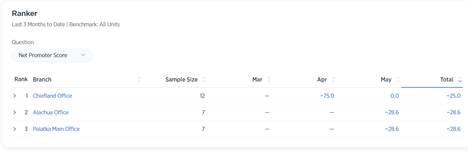
Ranker
This section displays office rankings.
- Click Analytics > Ranker.
- Use the view selector to choose your view.
- Question view - lists all offices selected
- Questions are located across the top
- Click on the question to sort based on the scores for that questions
- Time view - display the dates of the surveys
- Click the question drop-down menu to select a question
- Question view - lists all offices selected
Closed Loop - Inner Loop
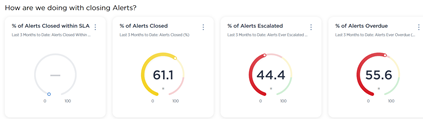
How are we doing with closing alerts?
Provides a high-level graphic overview of alerts closed and at what status.
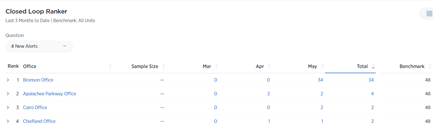
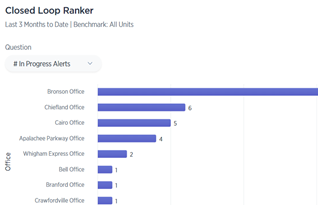
Closed Loop Ranker
Use the view selector to choose one of the following:
-
Question view- lists all offices selected
- Questions are located across the top
- Click on the question to sort based on the scores for that questions
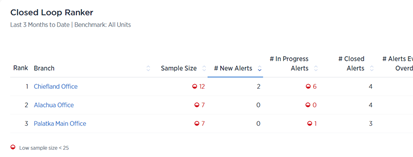
-
Time view- displays the dates of the surveys
- Click the question drop-down menu to select a question
- Data populates by office and date
- Bar view- displays the dates of the surveys
- Click the question drop-down menu to select a question
- Data populates by office and number
Closed Loop - Outer Loop
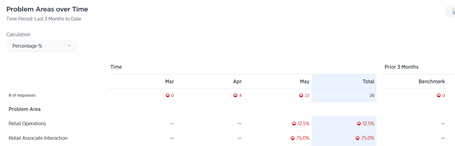
Problem Areas over Time
View problem areas and determine which areas are higher and lower across time periods.
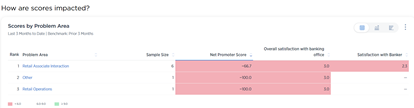
How are scores impacted?
View how scores on various questions and drivers impact problem areas.
- For example: Sort by new promoter score and the problem areas displays the list in order, allowing you to see which problem areas had the most and least impact on the net promoter score
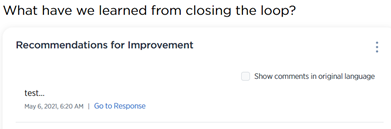
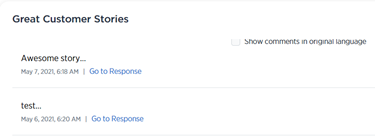
What have we learned from closing the loop?
Here you can find:
- Recommendations for improvement
- Great client stories
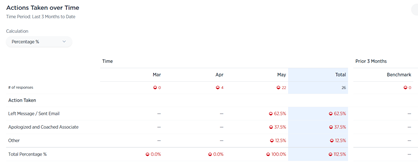
Actions Taken over Time
View the alert details and actions taken on alerts.
How do I .... guides
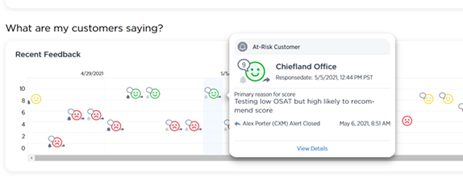
... see what my clients are saying?
- Do one of the following:
- CXM - Click My Branch > Overview.
- RXM - Click Overview > Region.
- Scroll down to the What are my customers saying? section.
- Response icons are displayed by date and time.
- Use the scroll bar across the bottom to expand the view.
- Hover over any icon to view more information.
- Click View Details to open the alert, work the alert and/or view additional information.
... view performance of the office in my region?
- Click Analytics > Ranker.
- Click Show Filters.
- Use the Time Period drop-down menu to choose the time period.
- Enter your Region ID.
- Use the drop-down menu to choose the Question Group.
- Ensure the Rank field is set to Office.
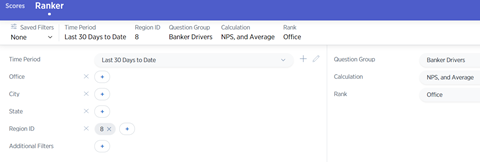
- Click Run. The ranker screen displays.
- Offices are listed on the left
- (Score) drivers are listed across the top
- Click on any Driver to rank your offices according to that Driver.
... view the overall performance of my region?
- Click Analytics > Scores.
- Click Show Filters.
- Use the Time Period drop-down menu to choose the time period.
- Click Run.
- From the view selector, choose your view.

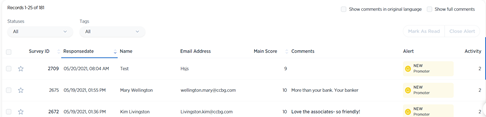
... see how my region is responding to alerts?
- Click Feedback > List.
- A list of alerts in your region displays with the following information:
- Survey ID
- Response date
- Client name
- Client email
- Main score
- Comments
- Alert
- Allows you to see the status of an alert (new, overdue, escalated) and the classification of the alert (promoter, at risk)
- Activity
- Displays how many time the alert has been touched
- Sort alerts by column by using the arrows next to the column description.
- Use the Statuses drop-down menu to further refine your view.
... compare a specific office to the rest of the region/bank?
- Click Analytics > Scores.
- Click Show Filters.
- Use the Time Period drop-down menu to choose the time period.
- Best practice: For benchmarking, do not use the daily view
- In the Office field, click the + to select the office you would like to compare.
- In the Benchmark field, select one of the following:
- All Units - compare against the rest of your region
-
All Branches - compare against the bank as a whole
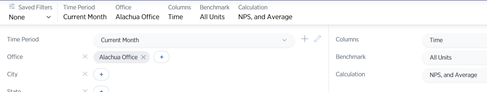
- The office scores on key metrics expand on the left.
- All units Benchmark displays on the right.