Regional Experience Managers (RXM) can see data from their region as a whole, as well, as having the ability to drill down into scores for each office.
From the StarMeter dashboard, Regional Experience Managers (RXM) can see the following:
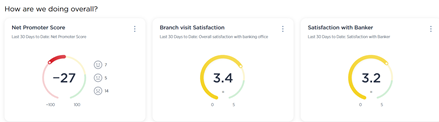
How are we doing overall?
Provides a glance snapshot of key indicators.
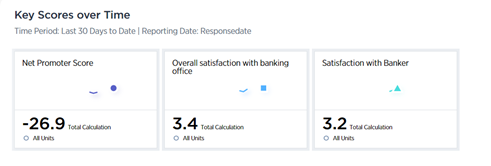
Key Scores over Time
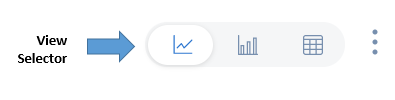
The filters selected displays under the Key Scores Over Time title. Use the view selector field to select a line, column, or table view of the data.
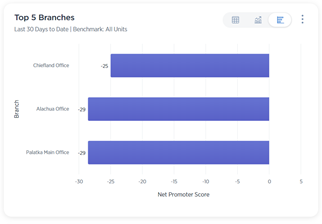
How are we doing across key segments?
This section displays your top and bottom 5 offices for the selected filters. Use the view selector field to select a line, column, or table view of the data.
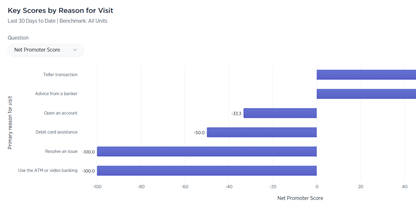
Key Scores by Reason for Visit
Use the question drop-down menu to select the question and view the data.
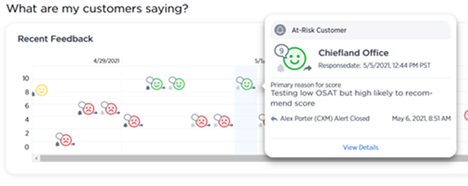
What are my clients saying?
- Feedback icons are sorted by date and time
- Hover over any icon to view more information
- Click View Details to expand the alert, work the alert and/or view additional information
Additional questions about StarMeter can be sent to _Star Meter Support.